

LaBute Advanced Indicators
Explanation of the highs and lows indicator
When added to the chart, it will appear like this
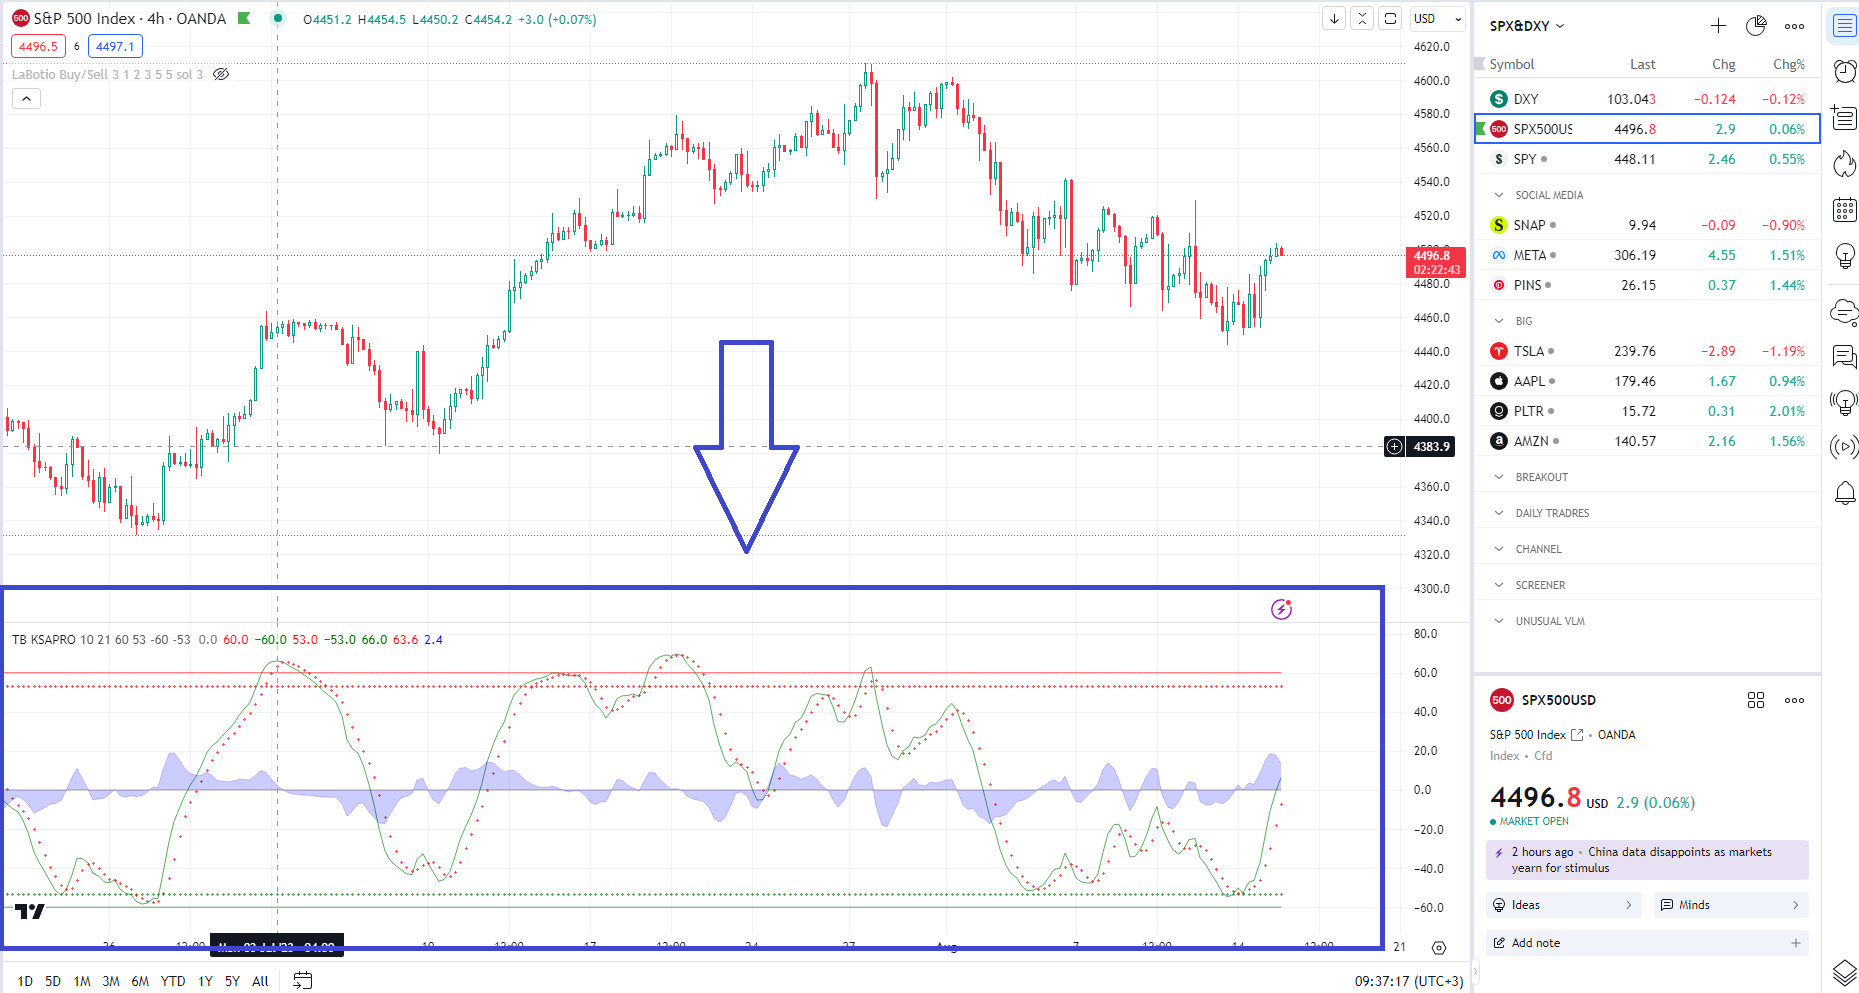
You can change the appearance by clicking on the indicator settings icon, and we advise you not to change the inputs.
Now we will explain and understand the advantages of advanced Labbott indicators for tops and bottoms
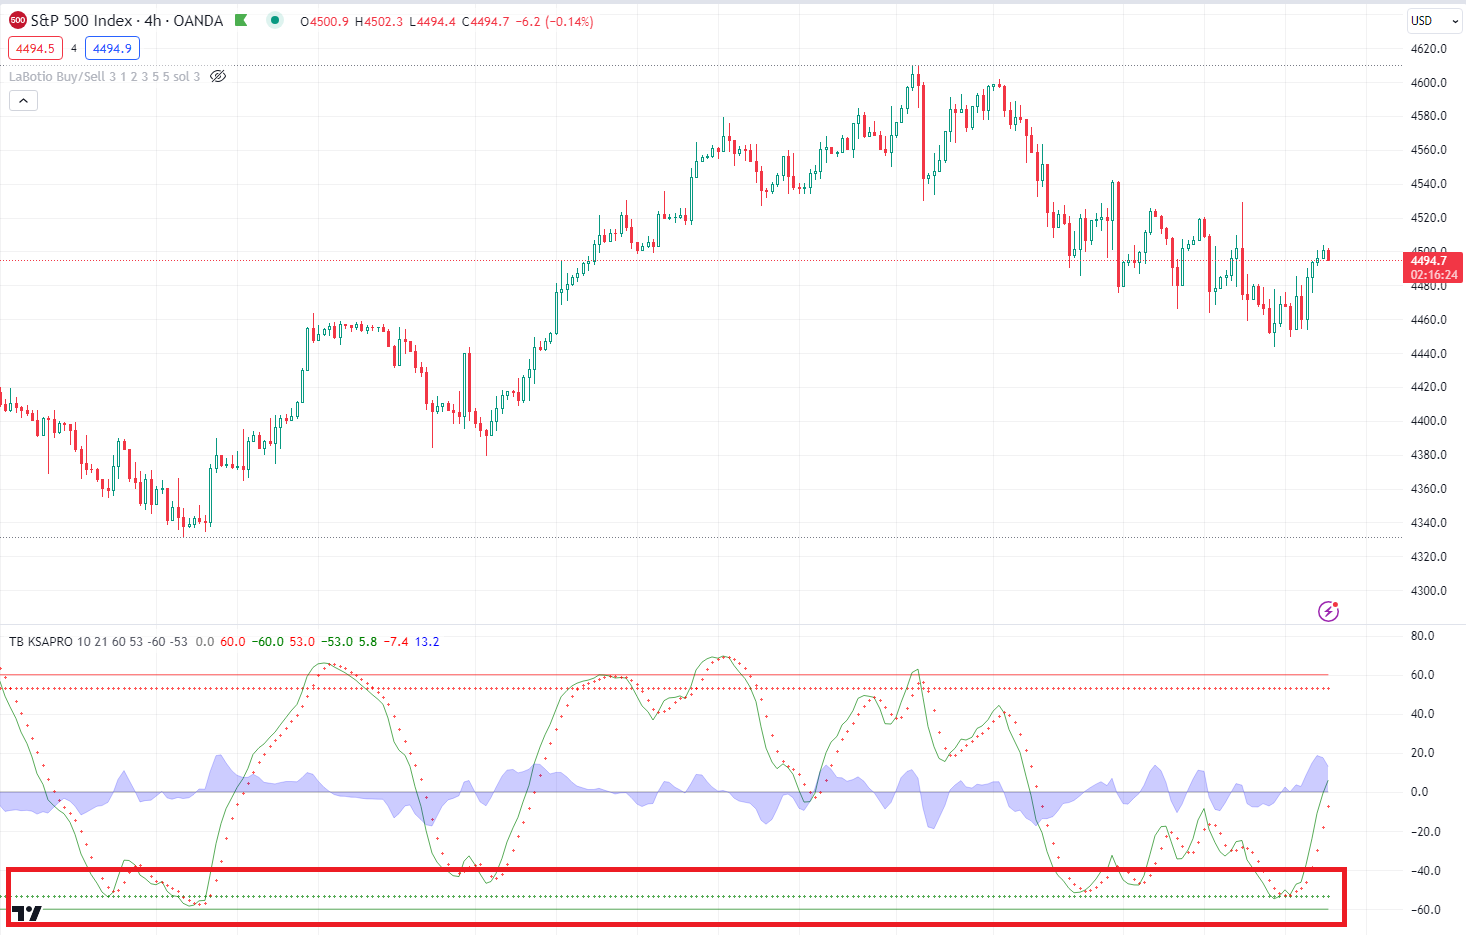
Bottoms areas:
As you can see in the following image (the red box at the bottom), it is considered a bottom area, in other words, the stock or currency has reached saturation and it is likely that there will be a rise in the future.
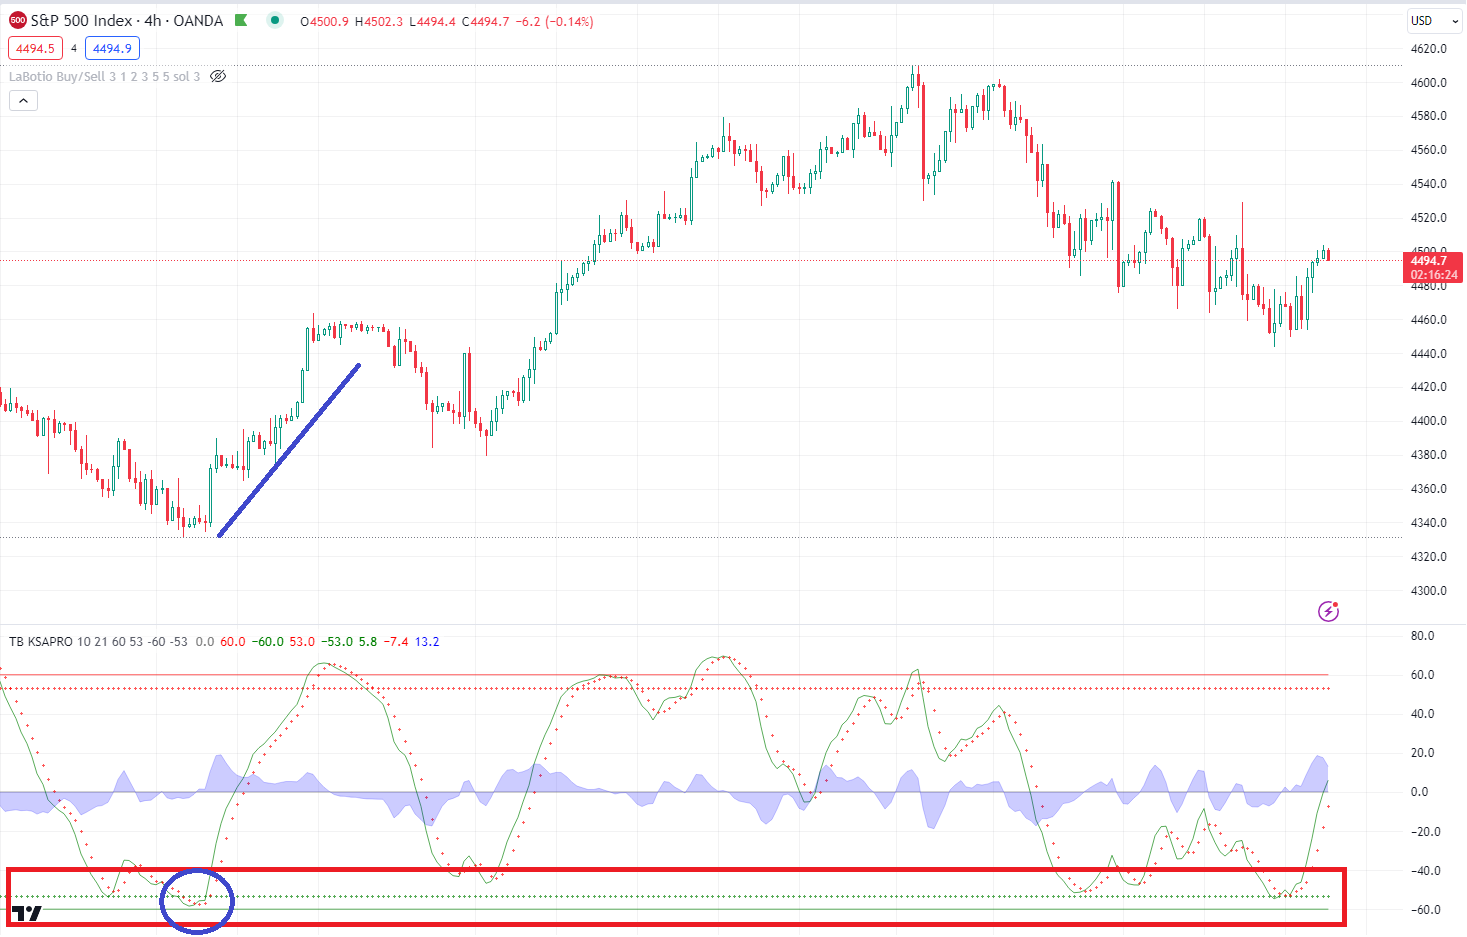
How can I expect a rebound and rise in the future?
As you can see in the following image:
The green + line and red dots reach the bottom level
The green line intersects over the red dots
You can use the Volume indicator, as well as your experience in technical analysis, and depending on your goal, to anticipate an upward rebound
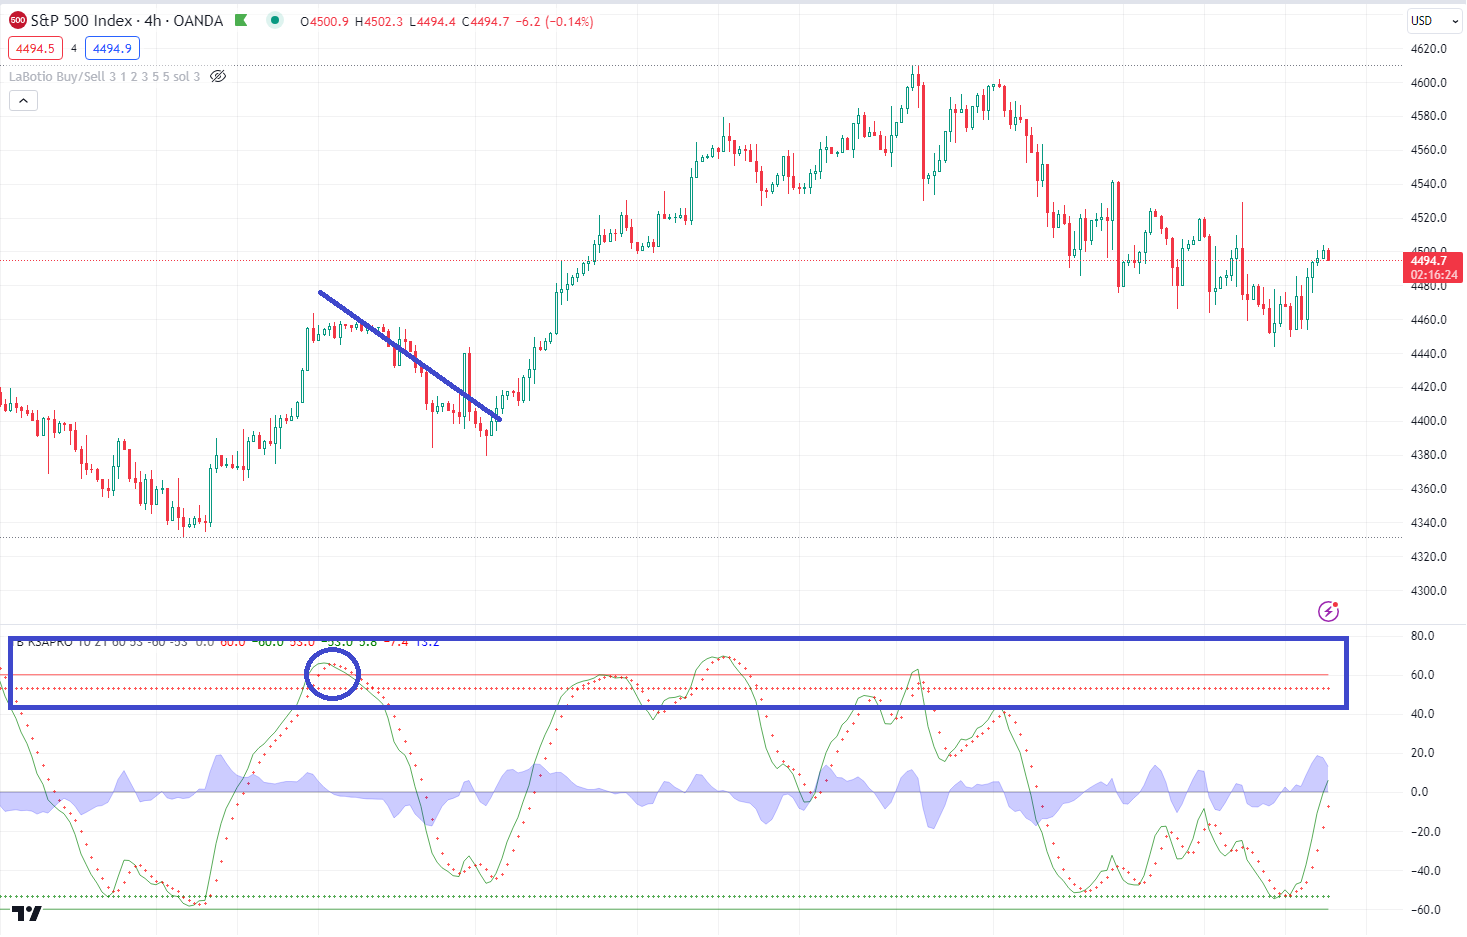
Peak areas:
It is the upper area of the indicator: as you can see in the following image:
Where the landing happened when he arrived
The green line of the summit area
As well as the red dotted line for the peaks area
Then the negative intersection occurred, which is the green line below the red dotted line
To get better results! It is preferable to use large frames, such as 4 hours or more